When it comes to data analysis, the availability of data on the web is quite vast, as such there is no lack of it for projects and learning purposes. However, the issue arises when it is too clean, too uniform, and does not reflect the reality of a job for example, where the database has the dirtiest data you’ve ever seen!
Real-world data is messy!
Working with clean datasets can be unrealistic for practice purposes because it does not teach the most time-consuming exercise, which is data cleaning.
This can be achieved through various methods, from mapping tables, Power Query ETL pipelines, or even directly from SQL. It all depends on your needs and the time you have at hand, but let’s not forget about Excel’s quick Find&Replace tool!
Lastly, in this article, I will guide you through the steps to add common types of errors and imperfections to a clean dataset.
Let’s turn a clean dataset into a dirty one
| Clean Dataset | Download Here |
| Dirty Dataset | Download Here |
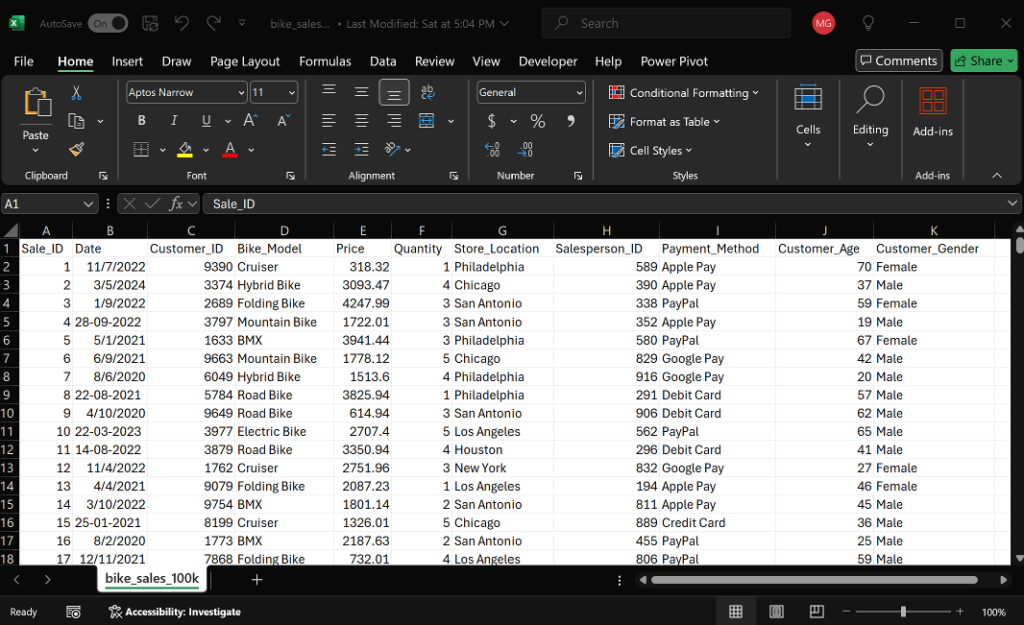
Firstly, it is worth us understanding the data we have at hand, by its columns:
- Sale_ID – unique identifier of an event triggered upon a sale
- Date – date identifier of the sale event
- Customer_ID – unique identifier of the precise customer that triggered the SALE_ID event
- Bike_Model – exact model of the bike sold
- Price & Quantity – self-explanatory
- Store_Location – precise geolocation of the store in said event
- Salesperson_ID – unique identifier of the salesperson that sold the product
- Payment_Method – means of payment
- Customer_Age & Customer_Gender – demographics
For randomizing our error-making, we will be using something called “a helper column”. We will insert a formula to help us randomize the error-making (so it is close to a real-life scenario)
Adding Common Data Entry Errors -> Typographical Errors and Inconsistent Naming
By using =RAND() we will generate a number between 0 and 1. Combining it with an IF statement such as below, we ensure approximately 15% of the records will be available for mutations.
=IF(RAND()<0.15,"Change Value","Not Applicable")Then simply filter for “Change Value”, you might notice that the values change, that is because RAND() executes on any action (as the calculation option is set to Automatic), we can ignore it.
Make sure to select the column (so changes only affect what is visually present), then use CTRL+F to open the Find and Replace tool. Get creative! Replace values with small text errors, for example:
| FIND | REPLACE |
|---|---|
| Mountain Bike | Mountan Biek |
| Hybrid Bike | Hibrid Bike |
| Road Bike | Rodao Bike |
| Cruiser | Crusair |
| Folding Bike | Floding Bik |
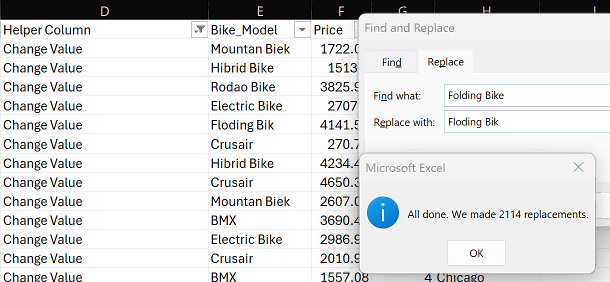
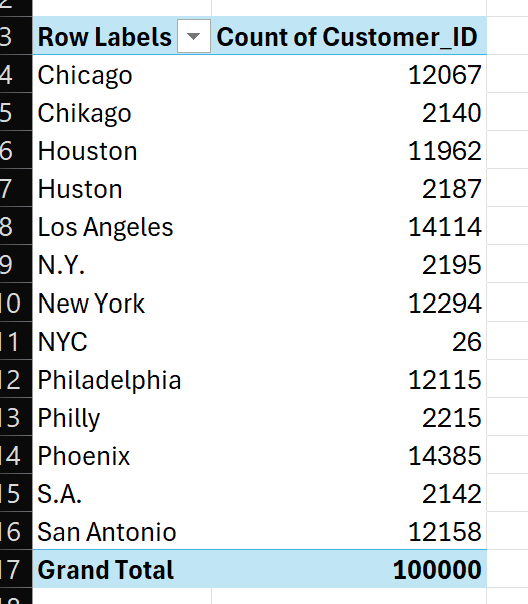
For inconsistent naming, filter the Helper Column for Change Value and Store_Location as below, following the changes:
| FROM THIS | TO THIS |
|---|---|
| Chicago | Chikago |
| Houston | Huston |
| New York | N.Y. or NYC |
| Philadelphia | Philly |
| San Antonio | S.A. |
Introducing Missing Values
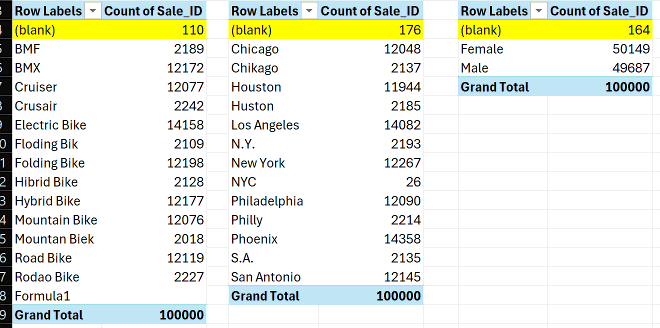
- Delete data from random cells in key columns like Bike_Model, Store_Location,
Customer_Gender. - You can either create a column using =IF(RAND()<0.1, ” “, E2) to randomly clear 10% of the column’s E data or use the Helper Column to filter and delete random chunks.
- Issues like missing values will always destroy the usability of the data, involuntarily creating outliers, values that don’t make sense without context, etc.
Date Formatting Issues
- Change data formats across different cells (i.e., some in “dd/mm/yyyy”, and others in “mm/dd/yyyy”).
- Simply use the Helper Column, select column B, and press CTRL+1, then head over to Custom and try the following formats for each filtering round:
- mm/dd/yyyy
- mm/d/yyyy
- yyyy/mm/dd
- mm/yy/d
Number Formatting Issues
- Change a few cells to different number formats (currency, percentage, text etc.)
- This will cause issues on aggregations and formulas, especially where values are treated as text instead of numbers.

Duplicating and Merging Errors
- Add duplicates by copying and pasting rows
- Duplicates can and surely will skew analysis as they offer an unrealistic view of the dataset
- Merge cells in places where data should be in a single column. You might also find when receiving data from SQL, headers will be merged.
- Filtering and sorting become difficult when there are merged cells, as it completely disrupts the flow by which Excel works
- Merged cells also disrupt how LOOKUP formulas work (for XLOOKUP, pulls all merged columns instead of desired field)
Adding Outliers and Extreme Values
- Randomly Add Outliers
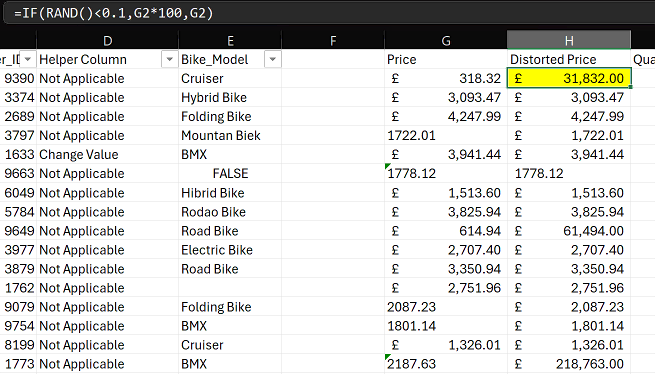
- Use =G2*100 to multiply random values in numeric columns, such as Price, Quantity, and Customer_Age with the help of the Helper Column.
- Alternatively, we can randomize which cells become outliers, using =IF(RAND()<0.1, G2*100, G2). This formula randomly increases around 10% of the values by a factor of 100.
- Outliers are values significantly higher or lower than the rest of the data. For example, a few extremely high sales amounts can increase the average, leading you to believe that overall sales are better than they actually are.
- Negative Values in Unexpected Places
- Add negative values where they don’t belong, such as Price or Quantity.
- Manually enter negative numbers in a few rows, or use a formula like =IF(RAND()<0.08,-ABS(I2),I2). This formula randomly transforms 8% of values into negatives.
- Negative values can be a red flag during analysis as they can indicate refunds, returns, or cancellations, but when added intentionally they will skew reporting and total figures.

Adding Extra Spaces
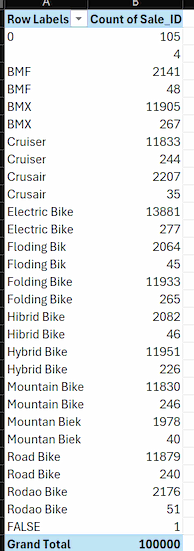
- Add trailing spaces to text data, which can be hard to detect visually. You can use a formula like =E2&” “. Try and get creative!
- Extra spaces can interfere with sorting, filtering, and matching functions. See for example the below pivot, where it cannot aggregate due to additional spaces.
Conclusion
We’ve added different types of errors – outliers, text-numeric mismatches, negative values, missing values, etc. and how to produce those at scale using the simple IF() and RAND() functions.
As real-world data often contains these errors, recognizing these issues is critical in knowing how to spot and correct them in order to produce accurate analysis. Excel offers built-in functions like CLEAN(), TRIM(), IFERROR(), and Conditional Formatting to detect and fix common issues. But let’s not forget about the king of the tools, Power Query!

1 thought on “How To Intentionally Dirty Up Data”